Project 5:
AMADA – Analysis of Multidimensional Astronomical Datasets
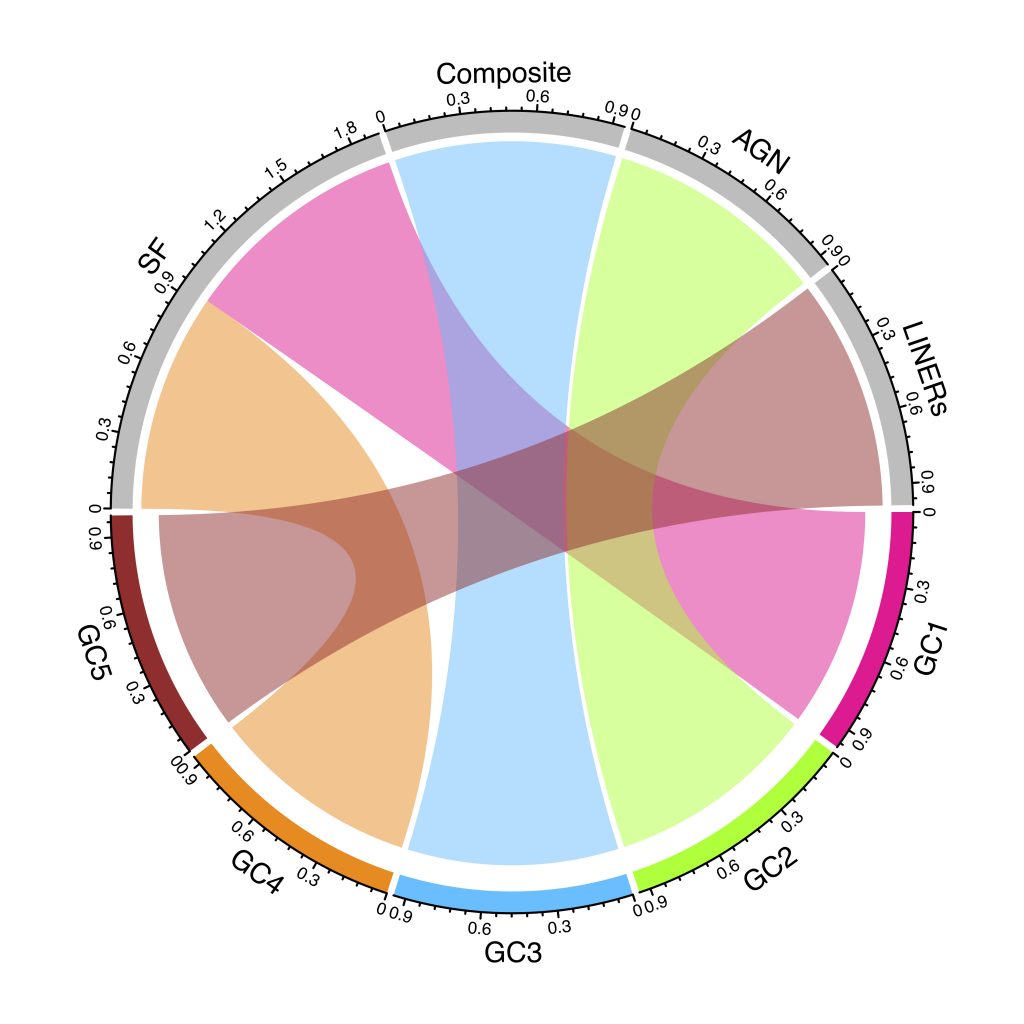
We present AMADA, an interactive web application to analyse multidimensional datasets. The user up- loads a simple ASCII file and AMADA performs a number of exploratory analysis together with contemporary visualisations diagnostics. The package performs a hierarchical clustering in the parameter space, and the user can choose among linear, monotonic or non-linear correlation analysis. AMADA provides a number of clustering visualisation diagnostics such as heatmaps, dendrograms, chord diagrams, and graphs. In addition, AMADA has the option to run a standard or robust principal components analysis, displaying the results as polar bar plots. The code is written in R and the web interface was created using the SHINY framework.
Full citation: de Souza and Ciardi, 2015, Astronomy and Computing, 12, 100-108
Pre-print – Bibtex – Package – Webapp
Team:
Rafael S. de Souza, U. North Carolina (USA)
Benedetta Ciardi, Max Planck Institute for Astrophysics (Germany)
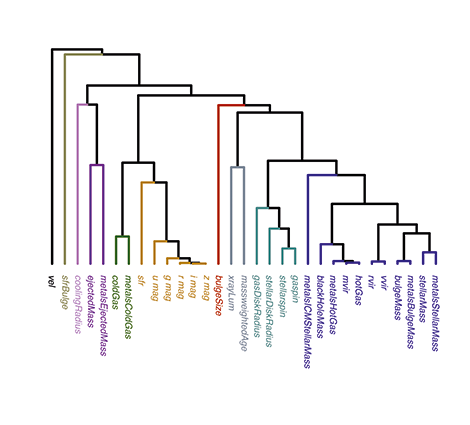
Dendrogram of the galaxy properties from the Guo et al. (2011) catalog. The different sub-groups of galaxy properties, assigned using the Calinski and Harabasz index, are colored according to the cluster assignment.