Cosmoabc: Likelihood-free inference via Population Monte Carlo Approximate Bayesian Computation
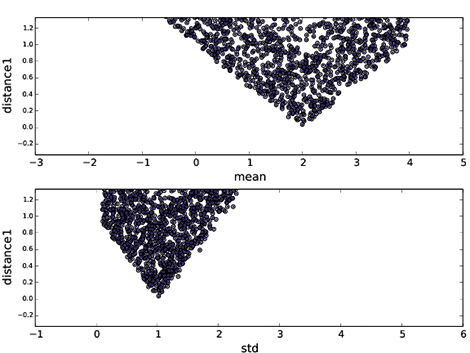
Behaviour of a sufficient summary statistics as a function of the parameters of our toy model.
Due to the increasing amount of data and their complex modelling in all areas of astronomy and cosmology, more and more computational power is required in order to explore larger parameter spaces whose internal correlations can often be impractically complicated or unknown. Thus, obtaining a statistical tool which bypasses the need of fully evaluating the likelihood is imperative.
This project presents cosmoabc, a Python implementation of Population Monte Carlo Approximate Bayesian Computation (PMC-ABC) algorithm with adaptive importance sampling. cosmoabc is the first such implementation targeted to the astronomy and cosmology community. The cosmological simulations are done through a connection with the Numerical Cosmology library (numcosmo), but the code is flexible enough for user-specified distance, simulation and prior functions.
We demonstrated the power of cosmoabc in estimating posterior probability distributions in two situations: a simple toy model and a complex cosmological simulation of a Sunyaev-Zeldovich survey. In both cases, we show how cosmoabc allows a good approximation of the true posterior probability distribution with a fairly simple and user friendly interface.
ELEPHANT represents an effective strategy to filter extragalactic events within large and complex astronomical alert streams. There are many applications